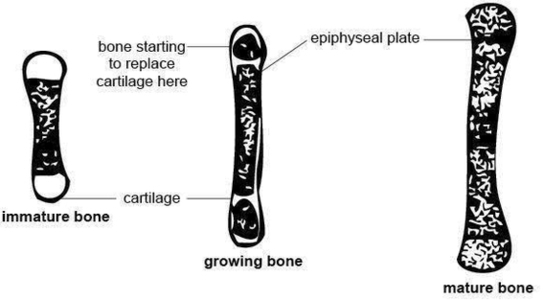
Bone Growth Diagram Image
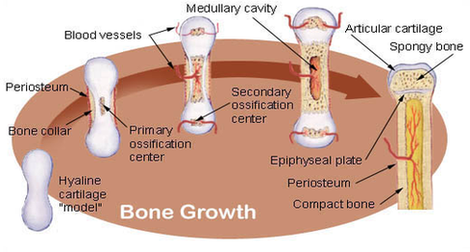
Bone growth diagrams show the progression of development of the bone over a period of time. This visually displays where a bone accepts blood vessels or where cartilage develops. This type of skeletal diagram also may show a cross section View Diagram Bone Growth Diagram Image