The Worldwide AIDS Epidemic
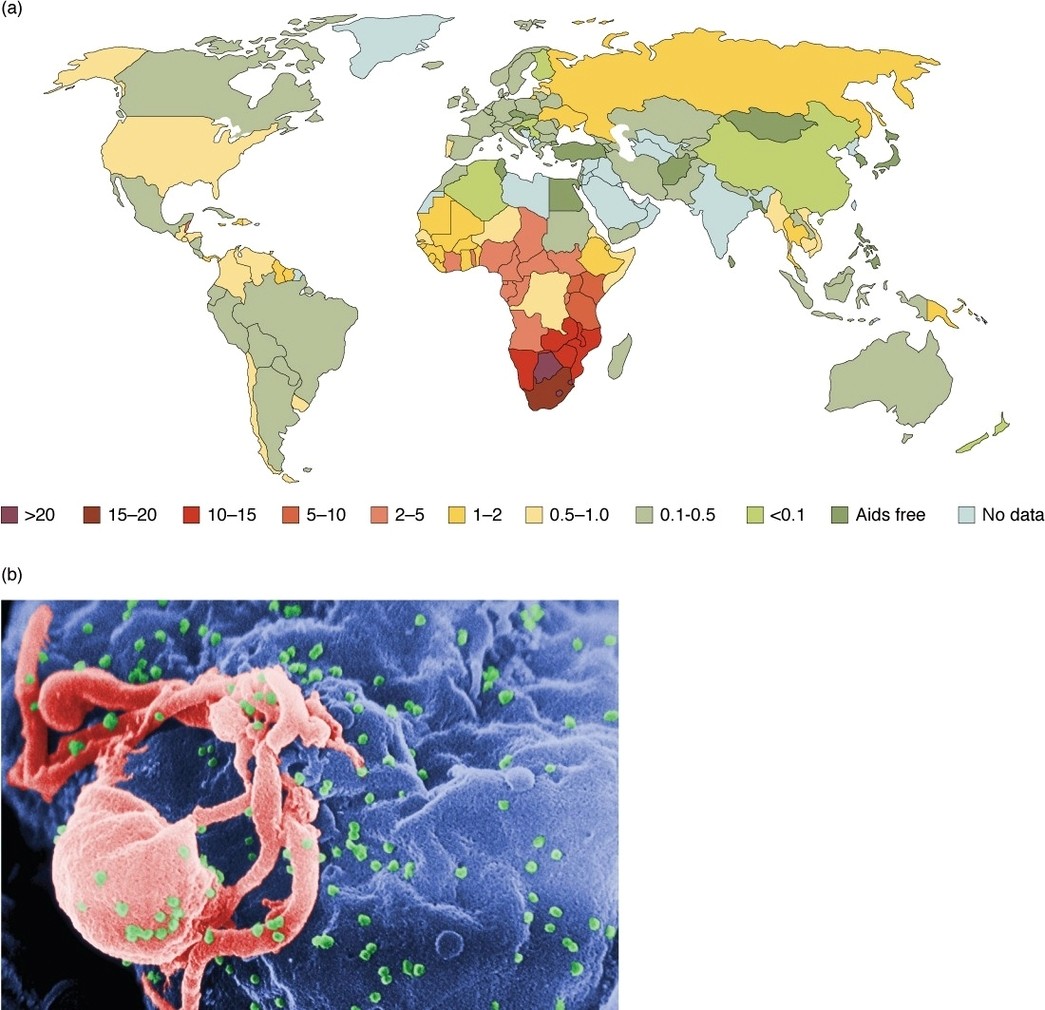
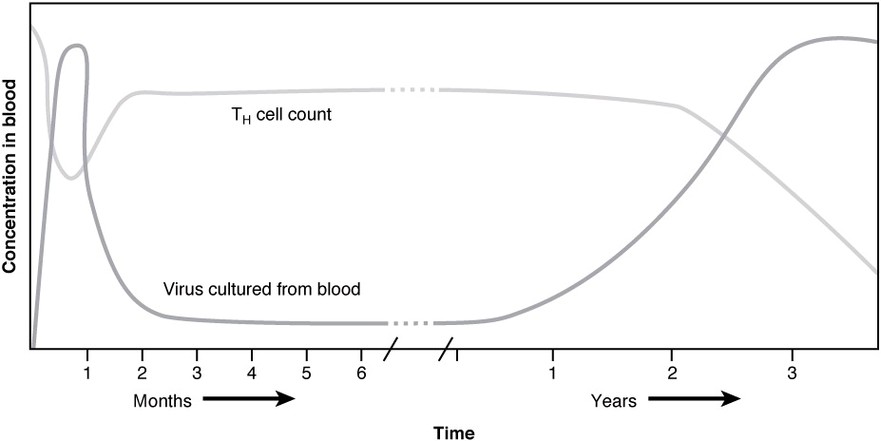
The Worldwide AIDS Epidemic: AIDS, caused by the HIV virus, has spread globally, with millions infected; it weakens the immune system by targeting CD4+ T cells, leaving individuals vulnerable to opportunistic infections and certain cancers.