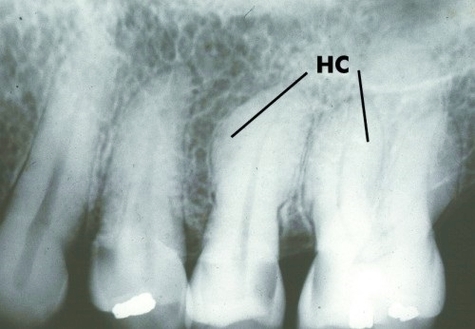
Coronavirus – Covid19 – Diagram

Coronavirus – Covid19 – Diagram

Below is the Corona virus diagram (Covid19, 2019-nCOV) explaining the symptoms of this respiratory virus with initial outbreak recorded in Wuhai, China. Symptoms of the coronavirus include fever, difficulty breathing, impaired liver and kidney function, kidney failure, severe cough, pneumonia. View Diagram Coronavirus – Covid19 – Diagram

Pulse

Pulse

Pulse Diagram – Pulse Rate – Pulse Chart – Pulse Table – Pulse charts depict normal pulse rates for humans as well as high and low pulse. Pulse rate by age group chart below indicates what are the normal resting View Diagram Pulse